Interactive Whiteboard Charts. Molecular Physics and Thermodynamics.
Interactive whiteboard charts enable the teacher to present the content material with the utmost visibility, to check its acquisition by students quickly and efficiently, to use problem-exploration, creative and differential educational methods, as well as encourage interest in studying the subject.
Features of the program
- Content material corresponds to the basic and profound level of the pupils’ academic background.
- Inclusion and exclusion of text entries, captions and formulae (Hide mode) provides for differential instruction.
- “Paging” option for viewing video materials by key frames with or without comments.
- A possibility to make notes, captions and drawings on top of the material studied (Draw tool) while changing the brightness of the picture or hiding it completely allows for a better practical acquisition of the educational material.
- Convenient navigation.
- Fast fetching of this or that element to the screen.
Contents
Thermodynamics
- The Basic Propositions of the Kinetic Theory
- Temperature in the Kinetic Theory
- The Equation of Ideal Gas
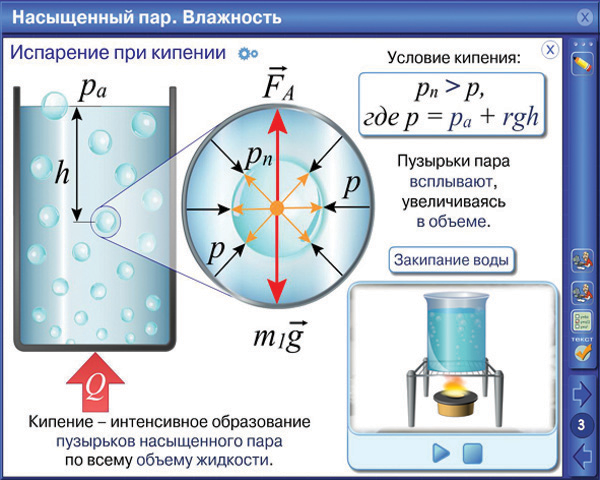
- Vapor Pressure. Humidity
- Solid objects
- Heat Transfer
- First Law of Thermodynamics
- Second and Third laws of Thermodynamics
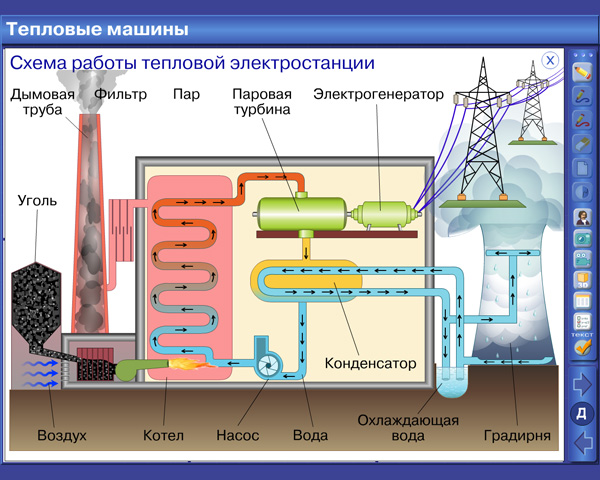
- Heat Engines
The theoretical material of the charts is accompanied by vivid and visual demonstrations of virtual lab experiments, video clips, animations, 3D models and interactive drawings.
Besides basic theoretical materials, each chart contains supplementary materials which broaden the possibility of its utilization in various aspects of pupils’ academic activities.
- Interactive experiments provide for modeling physical phenomena or processes and for conducting virtual physical experiments.
- Basic synopsis of the chart topic enables pupils to quickly actualize and systematize their knowledge.
- Printing questions and exercises will allow the teacher to quickly prepare quality hand-out materials for various types of tests.
- Historical background and a scientist’s biography bring the materials beyond the borders of a school manual and broaden pupils’ horizons.
- Tables related to the chart materials contain numerical data which may be used when solving the problems.
Two modes of information presentation:
- complete: when all the materials are presented;
- hidden: when only diagrams, tables, etc. are presented (while text entries are not shown on the screen).
Various modes of information presentation are used for creating conditions for problem exploration while explaining new materials, testing students during the lesson, as well as for self-testing while studying the topic at home.
The Draw tool, which is available in each presentation mode, will become an irreplaceable means of implementing problem-based and hands-on education. It allows for making notes, captions and additional drawings on top of any information module of the chart. It can help the teacher to:
- accompany her/his explanation of the new material with graphic commentaries, thus promoting its more effective acquisition;
- conduct various types of tests which correspond to the pupils’ academic level.
Application:
- Studying new material in the framework of problem-based learning.
- Consolidation of knowledge with the help of a comprehensive problem book with multi-level and multi-type problems (some tasks can be downgraded).
- Conducting projects and creative activities due to the chart’s interactive features and its content.
- Testing students with the help of the “Hide mode” and the Draw tool.
- Individual approach to learning.
- Independent study of some topics of the physics course due to abundant learning materials.
- Teacher’s lesson preparation proceeding from didactic goals: from just reviewing the textual and visual information to a thorough research of certain topics.
The series of charts has been designed on the basis of a substantial and constructive conception, which determines the appearance of the learning aid product and the method of its application. However, the efficiency of the interactive electronic learning aid product during the lesson depends on the teacher’s imagination, experience and her/his own methodological groundwork.
Using interactive charts during the lesson provides the teacher with an opportunity to encourage pupils’ activity and interest, to conduct a substantial dialog that would promote better acquisition of the studied material, to organize teaching in front of class, group and individual learning activities and to apply a differential instruction approach.
The learning aid product includes a CD with the program and a User’s Manual for educational institutions, which includes elaborate recommendations on how to use the program while working with an interactive whiteboard and in a networked computer classroom, as well as sample lessons and activities.